

Instana Provides A Single-Click Direct Path from Traces to Process Profiles; Adds SLO Support
Instana’s application performance monitoring solution is powering faster troubleshooting and problem resolution. With a single click, users now can drill down into profiles related to individual request/user traces that require investigation.
Instana continues to enrich APM functionality with deeper integration between its application monitoring, tracing and profiling capabilities.
The latest enhancement to Instana’s application performance monitoring solution enables fast troubleshooting with a single click. Users can drill down into profiles related to individual request/user traces that require investigation.
As for user experience, Instana’s update now gives users a one-click method to jump from a trace that needs deeper investigation directly to a profiling dashboard. This provides fast and easy access to a wide range of information they need to accelerating troubleshooting and issue resolution.
This one-click approach also speeds up the filtering out of extraneous profiles, showing only those profiles that match the time of the individual request, according to Chris Farrell, Instana’s technical director and APM Strategist.
“As applications continue to simultaneously grow in complexity and importance, the ability to identify performance bottlenecks and solve them quickly is paramount to successful application delivery,” Farrell said in a statement. “Instana’s single-click direct path from individual traces directly to applicable process profiles makes it both easy and quick for users to get the information they need to identify CPU, Memory and Concurrency issues and solve them.”
The latest deep integration builds on Instana’s acquisition of production profiling solution StackImpact in 2019, the company said.
The update also leverages Instana’s Always-On production profiling, allowing users to go back and profile their live code related to application slow-downs or problems after the fact. With this feature, complete profiles are available for up to a week.
Real-Time Kubernetes Environment Monitoring Using Instana
The update also follows this summer’s announcement of Instana’s ability to automatically discover and monitor a full range of Kubernetes resources, including clusters, nodes, namespaces, deployments, services and pods.
Instana’s Chris Engelbert, a senior developer advocate, described the innovation is a recent blog this summer.
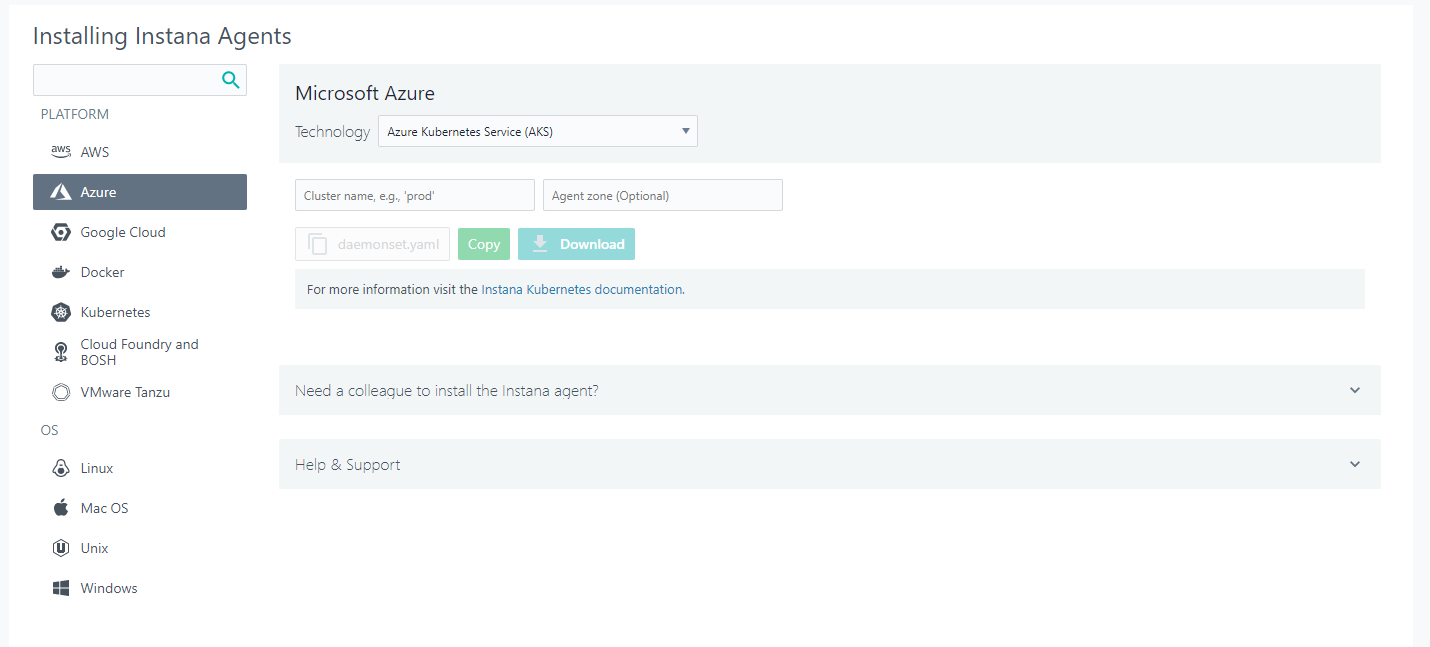
Instana has fully automated the installation of the monitoring agent into Kubernetes. By running a single Helm install command, the Instana agent is deployed as a DaemonSet into the Kubernetes cluster, and starts collecting information right away. The agent is automatically added to all schedule-able nodes in the cluster.
After deploying the Instana Agent, the configuration is completely automatic. The process for deploying the Instana Agent into the various Kubernetes distributions depends on the service provider. The Instana installation wizard provides a selection of k8s service providers to choose from, pre-populated with the required information.
It’s important to understand that Instana not only monitors the given metrics in real time, provided by Kubernetes itself, (as discussed earlier) but also monitors all the services being deployed into k8s, internal ones and custom business services. This includes end-to-end distributed tracing of every request flowing through all services.
After the Instana agent starts, every container in the Kubernetes cluster is scanned for supported technologies, automatically set up to be monitored, and added to Instana. The single agent implementation keeps the monitoring overhead extremely low and greatly simplifies the overall installation and maintenance process.
The benefit of using Instana is that all data, from Kubernetes, from the services, from sidecars, or even the physical hosts, are stitched together by Instana to provide a full, end to end view of the contextual dependencies and impact between the different components. This process only takes a few seconds, it doesn’t get much more real time than that.
Instana’s automated Application Performance Monitoring (APM) solution is architected to discover all crucial application service components and application infrastructure -- including AWS Lambda, Kubernetes and Docker. Instana automatically deploys monitoring sensors for each part of the application technology stack, traces all application requests and profiles every process – without requiring any human configuration or even application restarts.
The solution detects application and infrastructure changes in real-time, adjusting its models and visualizing the changes and any performance impact in seconds.
Instana Also Adds Service Level Objective Support
Instana is also integrating SLO (Service Level Objective) configuration, monitoring, and management. The enhancement provides critical troubleshooting capabilities to those responsible for application performance monitoring, tracing and profiling, thanks to the addition of automatic threshold determination and wizards to setup Instana Application Perspectives.
The full package aims to make it easier for organizations to implement and work with SLOs, according to company officials.
“The lines between IT Operations tools and performance management solutions continue to blur as application delivery teams strive to be the fastest to update application code,” said Chris Farrell, technical director and APM strategist at Instana in a statement. “Instana’s Service Level Objective support for critical applications and user journeys provide the easiest way for all application stakeholders to see whether or not a service, cluster or application is failing to meet objectives.”
Instana’s new SLO capabilities builds on Instana’s Application Performance Monitoring solution, specifically to work alongside the company’s Application Perspective Creation Wizard together make it easy for users to setup monitoring and visualize performance and service levels across User Journeys, Farrell added.
Instana’s SLO update was announced at DevOps World 2020 event, presented by CloudBees.


| Upcoming Events Click to Register |
|
|---|---|
| May 7, 2026 |
AI Deployment Summit |
| Jun 18, 2026 |
Re:Imagine the Enterprise! |