

Datadog Ships Continuous Profiler with Aim To Help Users Optimize App Performance
Datadog is looking to make app profiling more valuable and appealing to developers with its Continuous Profiler. The new low-overhead offering aims to help customers optimize app performance and code quality.
Cloud-based monitoring firm Datadog is shipping its Continuous Profiler, a low-overhead 24x7 code profiler that measures the performance of code in production.
Datadog Continuous Profiler aims to help customers optimize their applications' performance and improve the quality of their code.
"Profiling has always been one of the most promising, but underutilized tools in a developer's toolkit because of performance overhead,” said Renaud Boutet, Datadog’s vice president, product. Datadog Continuous Profiler provides “insights into real-world production code. In addition to performance improvement and troubleshooting, businesses can use profiling to right-size their cloud infrastructure,” he added.
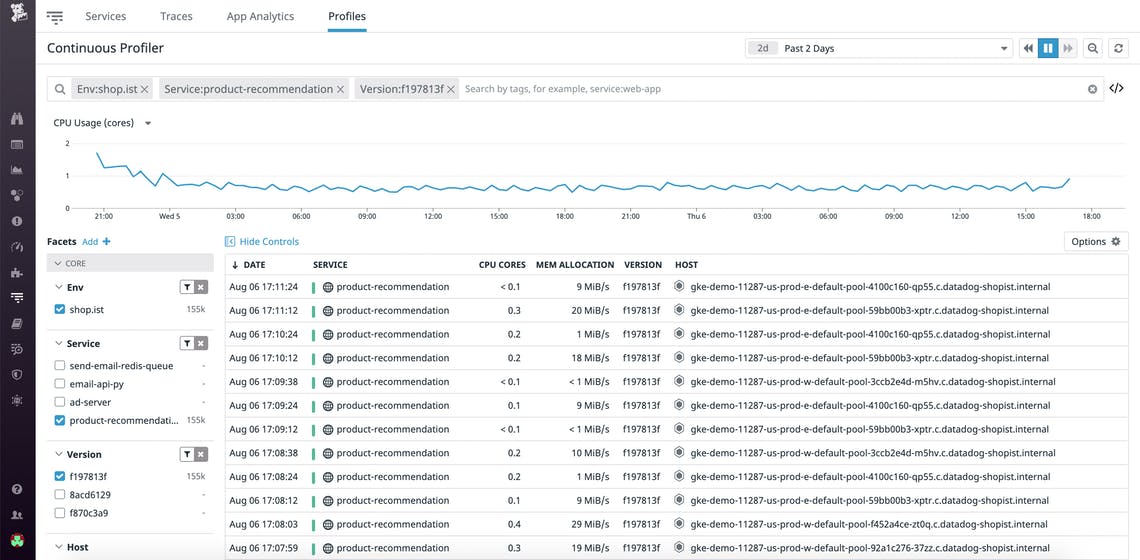
Datadog Continuous Profiler provides several benefits to developers and software engineers who manage business-critical applications that include:
Always-on: Datadog Continuous Profiler is built to be always-on, effectively debugging issues in all environments, all the time. Developers can access profiles captured before and during any downtime for postmortem analysis.
Automated analysis and insights: Datadog Continuous Profiler automatically performs heuristic code analysis and displays actionable insights for performance issues.
Choose from several types of profiles for deeper insights: Datadog Continuous Profiler goes beyond the CPU utilization profiling found in traditional solutions, with additional profiles that include memory allocation, lock profiling, wall time profiling, disk IO, and socket IO.
Integration with the Datadog Platform: Datadog Continuous Profiler is tightly integrated with the rest of the Datadog platform, so teams can quickly pivot with a single click to data from infrastructure monitoring, log management, synthetic monitoring, real user monitoring, and identify bottlenecks.
Thanks to the addition of Continuous Profiler, the Datadog platform can visualize all stack traces in one place. The Datadog website details how it’s done:
Continuous Profiler allows you to observe how your programs execute in production, so you can effectively diagnose and troubleshoot performance issues that occur under real-world conditions, such as OutOfMemoryError exceptions in Java and lock contention. At the same time, it could potentially surface lines of code that you were not even aware were adding unnecessary overhead to your application.
Continuous Profiler collects representative samples of all your stack traces—regardless of whether they come from your code or third-party libraries—and visualizes them as a flame graph. Each bar represents a function and is arranged vertically, from top to bottom, in the order in which it is called during a program’s execution. In the Java profile shown above, the width of each frame corresponds to its resource consumption, while its color identifies its package.
Inspecting these stack traces can help you understand the different ways your functions are called—and which ones are consuming the most resources. As your application scales, optimizing these resource-intensive sections of code can significantly reduce end-user latency and infrastructure costs. Depending on the language your program is written in, you can explore a variety of profile types, including CPU, memory allocation, lock, and I/O.”
Others features of Continuous Profiler include abilities to:
- Discover bottlenecks in code at a glance
- Zero-in on profiles using tags
- Correlate profiles and distributed traces seamlessly
- Get actionable insights for performance improvements
- Track long-term performance trends
Early adopters report benefits from the latest Datadog updates.
“Cvent has more than 30,000 customers who depend on us to deliver a world-class virtual event platform that is both flexible and scalable,” said Ian Schell, Site Reliability Architect at Cvent in a statement. “To support that effort, we run Datadog Continuous Profiler on every service in our testing and production environment, which grants us unprecedented insight into our applications, vastly lowering the time it takes to diagnose potential issues and fixing performance bottlenecks.”


| Upcoming Events Click to Register |
|
|---|---|
| Mar 26, 2026 |
A3 Summit: Apps, Agents & APIs |
| May 7, 2026 |
AI Deployment Summit |
| Jun 18, 2026 |
Re:Imagine the Enterprise! |