

1010data Updates Its Cloud-Based Insights Platform To Power Faster, Deeper Analytics 
1010data has updated its integrated cloud-based insights platform. Many new UI and data manipulation features aim to make it easier for more users to capture ‘ah-ha’ insights from raw data, spanning millions – even billions of rows. IDN speaks with 1010data’s Jon Katzur.
by Vance McCarthy
Tags: 1010data, analytics, cloud, Excel, insights, joins, parallel columnar database, time-series analysis,

vp of product

"Looking at the full clickstream data can be really powerful, and we make that easy to achieve."
Integration & APIs
 Enterprise-Grade Integration Across Cloud and On-Premise
As data volumes explode, so is another sector of intelligent data: How to sift through mountains of raw data to uncover an insight or relationship (not readily-apparent) that could really change the business? Oh, and, do it efficiently -- without the need for expensive PhDs.
On that front, 1010data Inc. has added a slew of new updates for its integrated cloud-based 1010data Insights Platform. In total, they are designed to make it easier for more users to uncover those ‘ah-ha’ insights by working directly with huge sets of raw data.
In a market space offering BI and visualization tools that aggregate data to give users a ‘big picture view’ or pre-packaged solutions (such as ‘path-to-purchase’), 1010data’s approach is different, Jon Katzur, VP of Product at 1010data told IDN.
“We focus on providing users a deep dive into massive and growing volumes of raw data,” he said. “There are times when to find big business value you want to look at every single click. As one of our customer’s CIO told us recently, ‘’We need to make decisions on absolutes -- not averages.’ So we know from experience, looking at the full clickstream data can be really powerful, and we make that easy to achieve.”
To do so, the 1010data Insights Platform is a pre-integrated cloud platform that combines a smart UI for customization and self-service with technologies under-the-covers for data management and analytics at huge scale.
“Our customers can interact directly with huge amounts of raw, granular data, which often means working with millions, or billions of rows [of data],” Katzur said., “For instance, one of our retail customers has 400,000 items they sell, and they have 44 million loyalty card members. They want to know, ‘What should we promote to these people?’”
To answer such questions, 1010data offers a spreadsheet-like interface gives users precise control and ease-of-use over massive amounts of data. In turn, this UI is married underneath to 1010data’s distributed parallel columnar database, powerful and flexible enough for time-series analysis, joins of large datasets, direct matches and even fuzzy joins, Katzur said. As a result, users have the UI and data tools “to figure out how to bring data sets together,” and uncover ah-ha relationships, he added.
For added flexibility – and to extend the reach of these discoveries, 1010data also lets users share results out to other BI tools.
101data Exploits the Power of Massive Dataset – Without Custom Integration or Coding
“We’ve found people want to interact with the huge datasets the same way they interact with Excel or a spreadsheet,” Katzur said. However, accomplishing that often requires a custom build, integrating many separate components, he noted.
Enter 1010data.
“People don't want to think about an entire stack – end users don't want to think about placing a database and a BI tool and a whole stack together. They just want to do ad hoc analysis with tons of data – but do it like you would in in Microsoft Excel,” Katzur said. “So, with 1010data, all the user needs is an Excel background -- versus the need for expertise to write R or Python code.”
1010data’s pre-integrated UI and back end technologies is what lets users “easily and rapidly do detailed, granular analysis on all their raw data – and not simply rely on results from aggregate pools of data,” he added.
In short, the combo if simple UI and powerful platform is what gives users the power and control to poke and prod huge data volumes to uncover the hidden nuggets that can lead to innovation and insights.
But even more than the technology, 1010data empowers a richer data exploration process. Katzur put it this way: “It’s the visual iterative and interactive approach to analysis on huge datasets that we provide--that’s why customers are attracted to 1010data.”
The latest edition, 1010data Insights Platform V11, builds on this approach with new interfaces, tools and under-the-covers capabilities. Among the updates are:
- More easily perform flat file uploads, from simple to sophisticated. A new 1010data Uploader lets users perform flat file uploads –– via a single, drag and drop interface. Users upload data files from their desktop into the Uploader or select from data accessible on the 1010data FTP server. The UI sports a wizard-like interface to guide users through every step of the data loading process. Further, 1010data automatically detects and specifies data types for each column -- and allows users to edit columns, column names, permissions and other attributes. To further ensure accuracy, the Uploader also provides an immediate preview of the first 20 rows of data.
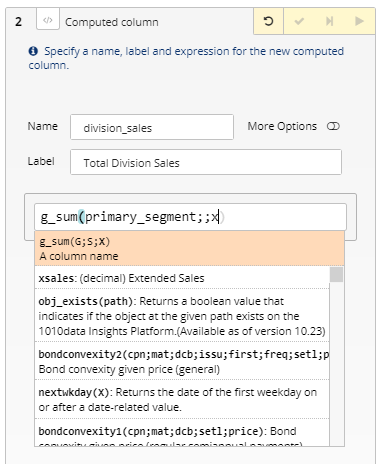
- Smarter ways to build calculations via an intuitive expression editor via the 1010data Expression Editor. This tool steps users through the completion of each argument – including a description of the argument as well as a list of available columns that can be used for the argument. This approach aims to allow users of any skill level to build calculations and advanced analytics. It taps into a rich library of functions already available on the 1010data Insights Platform.
- Better user control over exploring data, thanks to the addition of new data operations. This includes new ability to easily select data by simply pasting values from Excel, as well as ability to duplicate rows with select and expand. Users can also switch between different data views with a single click, including grid, single row, macro language, visualization, and split screen
- More easily share insights and distribute access, by allowing select users to easily schedule and manage queries across the team or organization
Beyond support for personalized views for end users, 1010data also sports a variety of tools and support for application and BI developers, including APIs, SDKs and command line options. Further, for data management / data engineering professionals, 1010 provides upload and management tools to make it easy to structure data for optimal performance across multiple steps – cleaning, joins and analysis.
1010data’s hands-on approach to working with data stands in contract to pre-packaged, ‘black box’ solutions, Katzur said, such as a pre-packaged ‘path-to-purchase’ solution.
In contrast to these ‘black box’ solutions, Katzur said 1010data lets users “use our time series analysis to figure out a deep path-to-purchase [view] and figure out which exact clicks worked.”
After that, the user can also join that data with other customer data to figure out other questions, such as: Are different segments in their path to purchase looking different? Are different search terms referring people to different entry points? “Because I have that line item clickstream, I can look at all that myself. Without 1010data, they’d need to ask IT to write SQL or some other [solution],” Katzur said.
So, while Katzur noted that using ‘black boxes’ “might get a good result the first time, he pointed out a downside. “Users don’t get to see or understand how the results happened -- or why. So, even if you made some money in the past, it might be hard to predict [success] will continue the next time,” he said.
Related:
- Next Pathway Leverages AI, LLMs To Speed, Simplify Cloud Migration Projects
- Gartner Says Only 12% of Infrastructure & Operations Leaders Exceed CIO Expectations
- Kinetica, ChatGPT Open a New Era of ‘Conversational Queries’ with Databases
- PwC Says ChatGPT API is Generative AI’s ‘Killer App’ – and 9 Other Insights
- BigPanda Launches ‘Alert Intelligence’ To Improve, Simplify AIOps, ITOps
All rights reserved © 2024 Enterprise Integration News, Inc.